    graph LR
    subgraph Data Science Initial Exploration
    A((Subject Mater Understanding <br> Define the Question))-->B((Data Gathering <br> Mining <br> Ethical Qusetions ))
    B-->C((Data Cleaning <br> Wrangling))
    C-->D((Data Exploration <br> Visualization <br> Exploratory Data Analysis))
    end

    subgraph Data Science Modeling
    D-->E((Feature Engineering <br> Data Preparation))
    E-->F((Predictive Modeling))
    F-->G((Data Visualization <br> Communication <br> Sharing))
    end
    G-->A

    style C fill:#f9f,stroke:#333,stroke-width:4px
Introduction to Data Science
Data Wrangling
Important Information
- Email: joanna_bieri@redlands.edu
- Office Hours: Duke 209 Click Here for Joanna’s Schedule
Announcements
Please come to office hours to get help!
Remember to come to lab! Wednesday 6-8pm Duke 206.
Day 5 Assignment - same drill.
- Make sure Pull any new content from the class repo - then Copy it over into your working diretory.
- Open the file Day5-HW.ipynb and start doing the problems.
- You can do these problems as you follow along with the lecture notes and video.
- Get as far as you can before class.
- Submit what you have so far Commit and Push to Git.
- Take the daily check in quiz on Canvas.
- Come to class with lots of questions!
—————————–
The Data Science Lifecycle
Today we are talking about Data Wrangling, which can takes place during the Initial Exploration part of the Lifecycle just after you get your data. However, as you do your analysis, sometimes you will realize that the data needs some more tidying. This is normal.
What is Clean or Tidy Data?
Characteristics of Tidy Data:
- Each variable forms a column
- Each observation forms a row
- Observational units form a table
Untidy Data:
- Anything other kind of mess.
This lab follows the Data Science in a Box lab “Wrangling and Tidying Data” by Mine Çetinkaya-Rundel and images were all created by the author. The content has been updated for our class and translated to Python by Joanna Bieri.
Some Examples of Data
Air force Data: Army Air Forces Statistical Digest, WW II
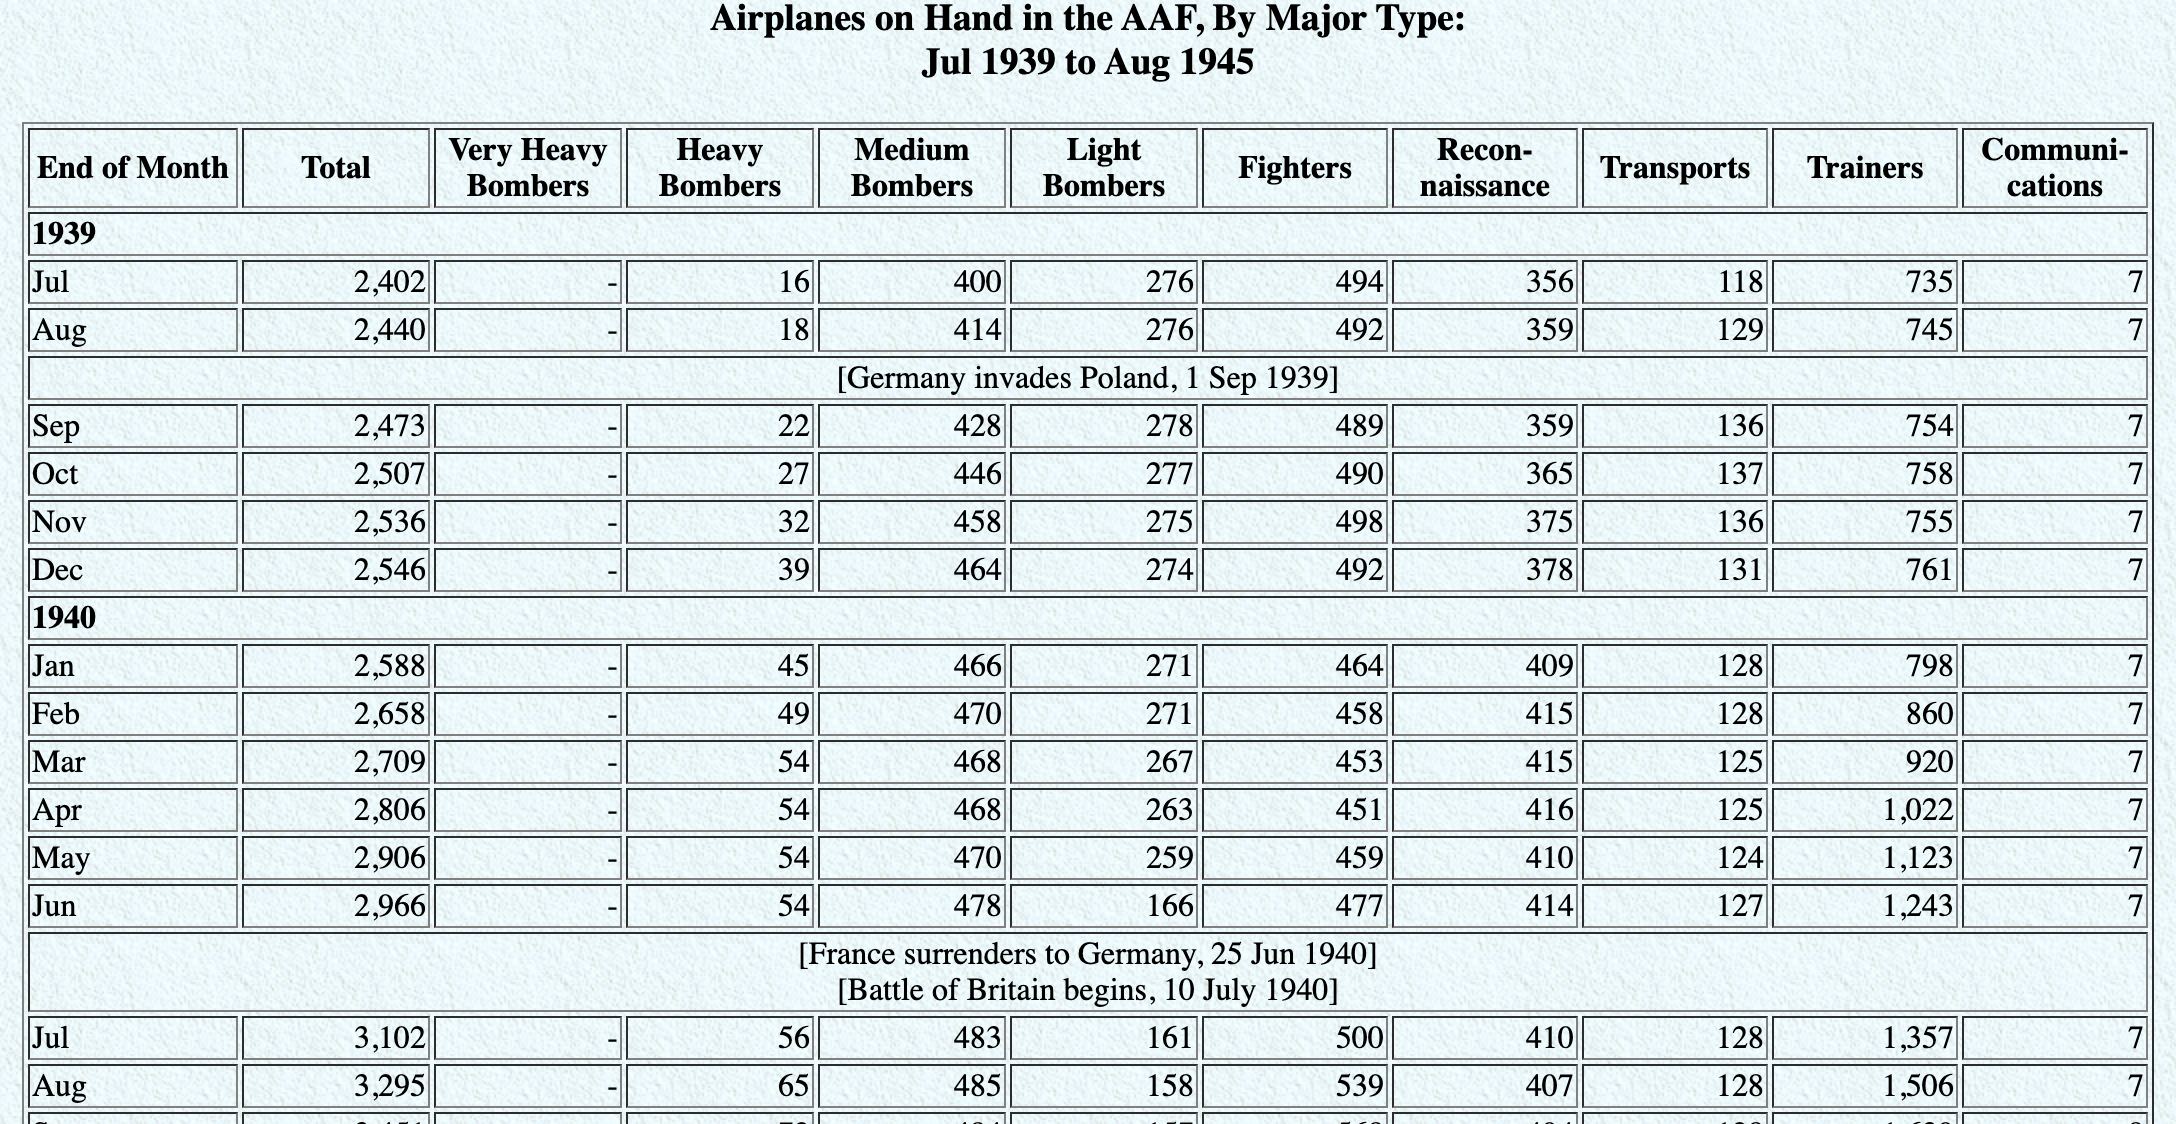
Is this tidy data? NO!
- Merged cells to represent date - we need to add a column for the year.
- Might be visually appealing, but not good for analysis.
- There are historical markers - we need to add a pre/post variable if we need this data.
Some Examples of Data
HIV Data: Gapminder, Estimated HIV prevalence among 15-49 year olds
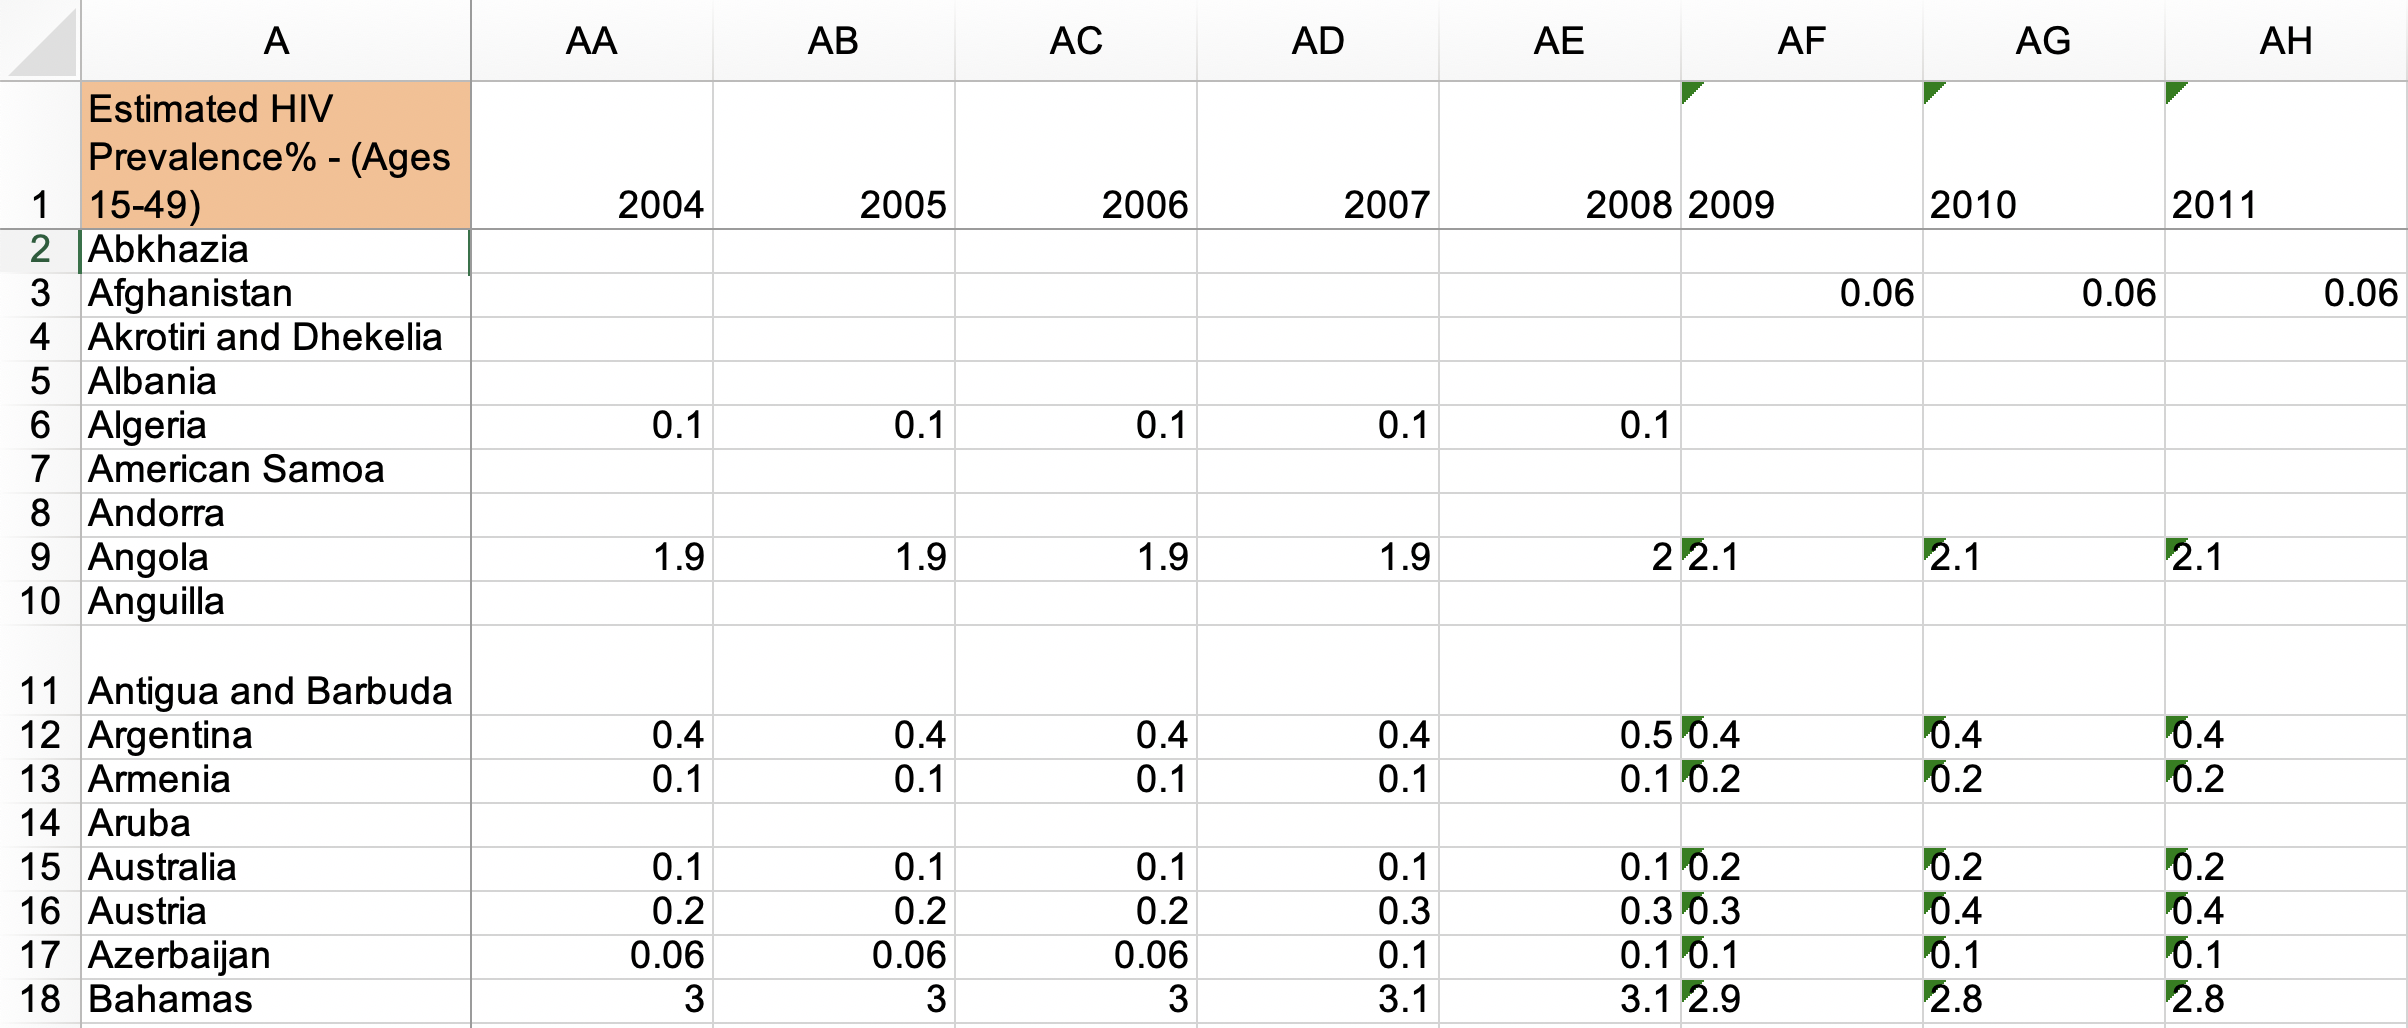
Is this tidy data? NO!
- The orange cell - this is a title for the data set instead of a variable name.
Some Examples of Data
Economic Characteristics Data: US Census Fact Finder, General Economic Characteristics, ACS 2017
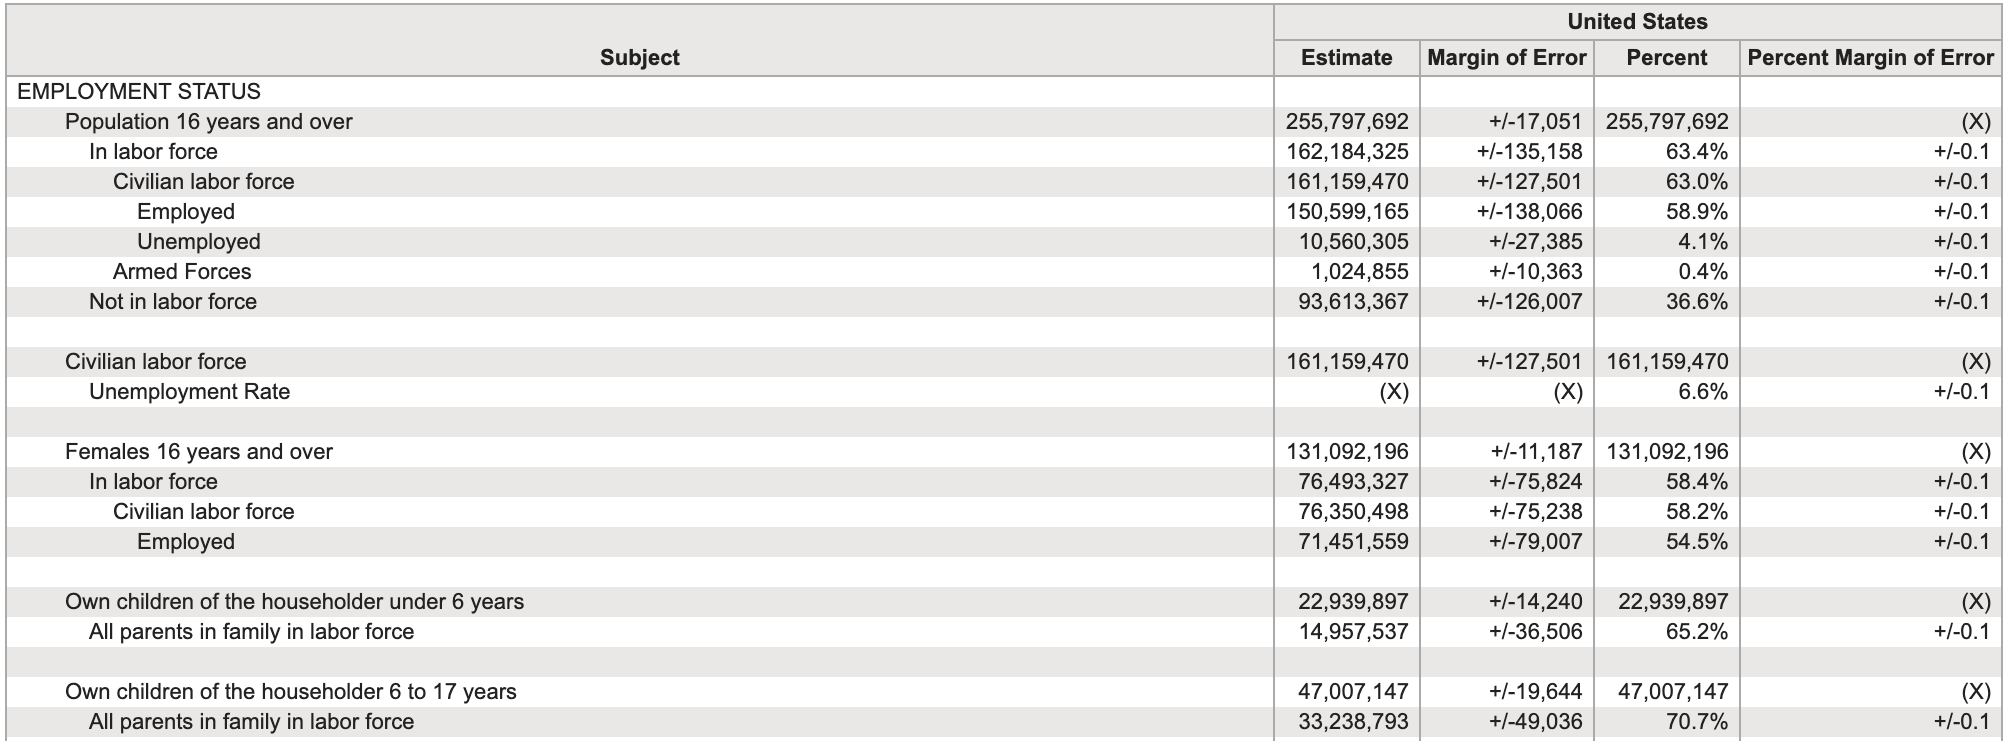
Is this tidy data? NO!
- This data is at the aggregate level. This data has already been synthesized and each cell means something different.
- Each cell means something different.
————————–
Displaying Data vs. Summarizing Data
Load the Data
import numpy as np
import pandas as pd

import matplotlib.pyplot as plt
import plotly.express as px
from plotly.subplots import make_subplots
import plotly.io as pio
pio.renderers.defaule = 'colab'

from itables import show
# Download the raw data
file_location = 'https://joannabieri.com/introdatascience/data/starwars.csv'
DF_raw = pd.read_csv(file_location)show(DF_raw)| name | height | mass | hair_color | skin_color | eye_color | birth_year | sex | gender | homeworld | species | films | vehicles | starships |
|---|---|---|---|---|---|---|---|---|---|---|---|---|---|
|
Loading ITables v2.1.4 from the internet...
(need help?) |
This data should look familiar! This is the Star Wars data from a few days ago. What you see here is my raw data. The data as I first opened it. Now I am being a bit more careful, notice how I give my data the variable name
DF_rawI want to make sure I don’t write over my raw data during my calculations!
Let’s reduce the number of variables
my_variables = ['name','height','mass']

DF_nhm = DF_raw[my_variables]

show(DF_nhm)| name | height | mass |
|---|---|---|
|
Loading ITables v2.1.4 from the internet...
(need help?) |
Displayed Data
If I was planning to do a lot of analysis just on these columns, I would typically create a new variable so I am sure not to overwrite or destroy my raw data. Here I gave the smaller bit of data the name:
DF_nhmto remind me that this has the columns name, height, mass. You can name your variables anything you want, but it is nice to choose things that are clearly understood.
Even thought this is a subset of our raw data, here we are still Displaying Data and this data is Tidy. What if we did some analysis. In the cell below we will get a count of the different genders in the raw Star Wars Data.
show(DF_raw['gender'].value_counts())| count | |
|---|---|
| gender | |
|
Loading ITables v2.1.4 from the internet...
(need help?) |
Summarized Data
This looks like a nice clean table! But is it Tidy? NO! In this case we are Summarizing Data. It might be nice to present this information in our analysis, but this data is aggregated. If we started with this data, we could not get back to the original data set.
Important Ideas - Data
- To do an analysis you need to start with Raw Data and that data needs to be Tidy
- Most of the time, our data will not be tidy, we will have to Clean and Wrangle it, keep track of all the things you do to clean the data.
- Once we have our Tidy Raw Data it is important to not overwrite it. We must keep a record of what we do at every step.
- Summarizing Data is an important part of data science. However, summary data is not enough to reproduce results. We must keep a record of what we do at every step.
Am I sounding like a broken record? We must keep a record of what we do at every step.
————————–
Data Wrangling
- We start with raw data and save it in a data frame
- The data frame stays on the left
- We can apply operations (functions) on the left
- The operations will not overwrite the data - so you can be experimental here and not lose your original data.
Load the raw data:
- Data from two hotels: one resort and one city hotel
- Observations: Each row represents a hotel booking
- Goal for original data collection: Development of prediction models to classify a hotel booking’s likelihood to be canceled Antonia et al., 2019
Data Information: Tidy Tuesday
file_location = 'https://joannabieri.com/introdatascience/data/hotels.csv'
DF_raw_hotels = pd.read_csv(file_location)
The first think I often want to do is just look at the data! There are lots of ways to do this:
Print to Screen
JupyterLab Notebook will just print the data frame if it is the last thing listed in the cell. Notice how it can only show the first and last few rows separated by three dots (…) in each column.
DF_raw_hotels| hotel | is_canceled | lead_time | arrival_date_year | arrival_date_month | arrival_date_week_number | arrival_date_day_of_month | stays_in_weekend_nights | stays_in_week_nights | adults | ... | deposit_type | agent | company | days_in_waiting_list | customer_type | adr | required_car_parking_spaces | total_of_special_requests | reservation_status | reservation_status_date | |
|---|---|---|---|---|---|---|---|---|---|---|---|---|---|---|---|---|---|---|---|---|---|
| 0 | Resort Hotel | 0 | 342 | 2015 | July | 27 | 1 | 0 | 0 | 2 | ... | No Deposit | NaN | NaN | 0 | Transient | 0.00 | 0 | 0 | Check-Out | 2015-07-01 |
| 1 | Resort Hotel | 0 | 737 | 2015 | July | 27 | 1 | 0 | 0 | 2 | ... | No Deposit | NaN | NaN | 0 | Transient | 0.00 | 0 | 0 | Check-Out | 2015-07-01 |
| 2 | Resort Hotel | 0 | 7 | 2015 | July | 27 | 1 | 0 | 1 | 1 | ... | No Deposit | NaN | NaN | 0 | Transient | 75.00 | 0 | 0 | Check-Out | 2015-07-02 |
| 3 | Resort Hotel | 0 | 13 | 2015 | July | 27 | 1 | 0 | 1 | 1 | ... | No Deposit | 304.0 | NaN | 0 | Transient | 75.00 | 0 | 0 | Check-Out | 2015-07-02 |
| 4 | Resort Hotel | 0 | 14 | 2015 | July | 27 | 1 | 0 | 2 | 2 | ... | No Deposit | 240.0 | NaN | 0 | Transient | 98.00 | 0 | 1 | Check-Out | 2015-07-03 |
| ... | ... | ... | ... | ... | ... | ... | ... | ... | ... | ... | ... | ... | ... | ... | ... | ... | ... | ... | ... | ... | ... |
| 119385 | City Hotel | 0 | 23 | 2017 | August | 35 | 30 | 2 | 5 | 2 | ... | No Deposit | 394.0 | NaN | 0 | Transient | 96.14 | 0 | 0 | Check-Out | 2017-09-06 |
| 119386 | City Hotel | 0 | 102 | 2017 | August | 35 | 31 | 2 | 5 | 3 | ... | No Deposit | 9.0 | NaN | 0 | Transient | 225.43 | 0 | 2 | Check-Out | 2017-09-07 |
| 119387 | City Hotel | 0 | 34 | 2017 | August | 35 | 31 | 2 | 5 | 2 | ... | No Deposit | 9.0 | NaN | 0 | Transient | 157.71 | 0 | 4 | Check-Out | 2017-09-07 |
| 119388 | City Hotel | 0 | 109 | 2017 | August | 35 | 31 | 2 | 5 | 2 | ... | No Deposit | 89.0 | NaN | 0 | Transient | 104.40 | 0 | 0 | Check-Out | 2017-09-07 |
| 119389 | City Hotel | 0 | 205 | 2017 | August | 35 | 29 | 2 | 7 | 2 | ... | No Deposit | 9.0 | NaN | 0 | Transient | 151.20 | 0 | 2 | Check-Out | 2017-09-07 |
119390 rows × 32 columns
Show the Data
The show() command will show the data in a nicer format and allow for simple searching and sorting.
show(DF_raw_hotels)| hotel | is_canceled | lead_time | arrival_date_year | arrival_date_month | arrival_date_week_number | arrival_date_day_of_month | stays_in_weekend_nights | stays_in_week_nights | adults | children | babies | meal | country | market_segment | distribution_channel | is_repeated_guest | previous_cancellations | previous_bookings_not_canceled | reserved_room_type | assigned_room_type | booking_changes | deposit_type | agent | company | days_in_waiting_list | customer_type | adr | required_car_parking_spaces | total_of_special_requests | reservation_status | reservation_status_date |
|---|---|---|---|---|---|---|---|---|---|---|---|---|---|---|---|---|---|---|---|---|---|---|---|---|---|---|---|---|---|---|---|
|
Loading ITables v2.1.4 from the internet...
(need help?) |
How many variables and observations?
In this data set we have 32 variables and 119,390 observations. That is enough data to be a bit overwhelming to just look at. Luckily Python can help!
What are the variable names (column labels?)
JupyterLab Notebook will just print the data frame if it is the last thing listed in the cell. Lets make a list of all the columns (also called keys)
columns_list = list(DF_raw_hotels.keys())
print(columns_list)
['hotel', 'is_canceled', 'lead_time', 'arrival_date_year', 'arrival_date_month', 'arrival_date_week_number', 'arrival_date_day_of_month', 'stays_in_weekend_nights', 'stays_in_week_nights', 'adults', 'children', 'babies', 'meal', 'country', 'market_segment', 'distribution_channel', 'is_repeated_guest', 'previous_cancellations', 'previous_bookings_not_canceled', 'reserved_room_type', 'assigned_room_type', 'booking_changes', 'deposit_type', 'agent', 'company', 'days_in_waiting_list', 'customer_type', 'adr', 'required_car_parking_spaces', 'total_of_special_requests', 'reservation_status', 'reservation_status_date']How many variables do you have?
If I want to count the variables I need to count the columns. Remember I can find the length len() of the list above.
print(len(columns_list))32Print variable names more nicely
To do this I use something called a for loop. This will go one-by-one through the list and print each column name nicely. You don’t have to understand what this is doing right now!
for column in columns_list:
    print(column)
hotel
is_canceled
lead_time
arrival_date_year
arrival_date_month
arrival_date_week_number
arrival_date_day_of_month
stays_in_weekend_nights
stays_in_week_nights
adults
children
babies
meal
country
market_segment
distribution_channel
is_repeated_guest
previous_cancellations
previous_bookings_not_canceled
reserved_room_type
assigned_room_type
booking_changes
deposit_type
agent
company
days_in_waiting_list
customer_type
adr
required_car_parking_spaces
total_of_special_requests
reservation_status
reservation_status_dateFocus on a specific column or columns (Slicing)
You just need to grab the column name (exactly spelled) and then tell the data frame to show only that column. You have seed code like this before:
DF[['column1','column2',...]]You start with the variable name of the data frame, and then inside the square brackets you put the columns you are interested in.
For our data we will focus on the columns “hotel” and “lead_time”. Here are two ways to do this:
DF_raw_hotels[['lead_time']]| lead_time | |
|---|---|
| 0 | 342 |
| 1 | 737 |
| 2 | 7 |
| 3 | 13 |
| 4 | 14 |
| ... | ... |
| 119385 | 23 |
| 119386 | 102 |
| 119387 | 34 |
| 119388 | 109 |
| 119389 | 205 |
119390 rows × 1 columns
my_columns = ['lead_time']
DF_raw_hotels[my_columns]| lead_time | |
|---|---|
| 0 | 342 |
| 1 | 737 |
| 2 | 7 |
| 3 | 13 |
| 4 | 14 |
| ... | ... |
| 119385 | 23 |
| 119386 | 102 |
| 119387 | 34 |
| 119388 | 109 |
| 119389 | 205 |
119390 rows × 1 columns
In the first example I just listed the columns in the same line as the data frame. In the second example I stored the columns names in variable called my_columns and then gave that information to the data frame. I personally like the second way better unless I am in a hurry.
Q Can you figure out how you would focus on multiple columns?
Sorting the data
Ascending Order
Often you want numerical data sorted ascending or descending. To do that we can use the sort_values() command. Here is an example of how to sort by the column named “lead_time” in ascending order:
my_columns = ['hotel','lead_time']
DF_raw_hotels[my_columns].sort_values('lead_time')| hotel | lead_time | |
|---|---|---|
| 93639 | City Hotel | 0 |
| 109367 | City Hotel | 0 |
| 85641 | City Hotel | 0 |
| 31987 | Resort Hotel | 0 |
| 16114 | Resort Hotel | 0 |
| ... | ... | ... |
| 65235 | City Hotel | 629 |
| 65231 | City Hotel | 629 |
| 65245 | City Hotel | 629 |
| 4182 | Resort Hotel | 709 |
| 1 | Resort Hotel | 737 |
119390 rows × 2 columns
Descending order
To descend the order of sorting we just add an optional flag. Can you spot the difference in the code?
DF_raw_hotels[my_columns].sort_values('lead_time', ascending=False)| hotel | lead_time | |
|---|---|---|
| 1 | Resort Hotel | 737 |
| 4182 | Resort Hotel | 709 |
| 65240 | City Hotel | 629 |
| 65249 | City Hotel | 629 |
| 65245 | City Hotel | 629 |
| ... | ... | ... |
| 85725 | City Hotel | 0 |
| 85726 | City Hotel | 0 |
| 85758 | City Hotel | 0 |
| 85759 | City Hotel | 0 |
| 20017 | Resort Hotel | 0 |
119390 rows × 2 columns
Here you start to see how we can combine command in Python. First we sub selected the columns we care about:
DF_raw_hotels[my_columns]Then we added on the sorting
DF_raw_hotels[my_columns].sort_values('lead_time')Each time you call a command like this it produces (returns) another data frame, but does not change the original data. So if you wanted to keep a copy of the sorted data to work with, you would have to save a copy(). Unless you are working with a HUGE data set and worried about running out of memory on your computer, you can just make copies and save them with new variable names (nicknames).
DF_leadtime_sorted = DF_raw_hotels[my_columns].sort_values('lead_time', ascending=False).copy()show(DF_leadtime_sorted)| hotel | lead_time | |
|---|---|---|
|
Loading ITables v2.1.4 from the internet...
(need help?) |
Q Choose another set of variables (columns) that you can explore. Try sorting them ascending and descending.
Q What would happen if you tried to sort categorical data? Try sorting by the column “arrival_date_month”. Do you get an error? Does it sort it? If so how is it sorted?
My code if you need it:
DF_raw_hotels[[“hotel”,“arrival_date_month”]].sort_values(“arrival_date_month”)
Sub selecting specific categorical data
Maybe my analysis only concerns specific hotels. In other words I am investigating only resorts. I can easily get this information by creating a boolean mask.
A boolean mask is a fancy way to say a bunch of True and False data. Here is an example of checking whether the column named “hote” has the categorical data “Resort Hotel” in each observation:
DF_leadtime_sorted['hotel']== 'Resort Hotel'1 True
4182 True
65240 False
65249 False
65245 False
...
85725 False
85726 False
85758 False
85759 False
20017 True
Name: hotel, Length: 119390, dtype: boolNotice the double equals (==) this is telling Python to test the truth of the statement. What does this do
- It goes to each observation (row) in our mini-data frame (DF_leadtime_sorted). I checks what value is in the “hotel” column and then asks “Is this equal to”Resort Hotel”?
- For the first row it is True, second row True, third row False…
- Go back and look at the data and convince yourself that the code is getting the right answer.
Let’s save this information in a variable
mask = DF_leadtime_sorted['hotel']== 'Resort Hotel'Now we can give this mask to the data frame and it will only show us observations (rows) where “Resort Hotel” is true.
DF_leadtime_sorted[mask]| hotel | lead_time | |
|---|---|---|
| 1 | Resort Hotel | 737 |
| 4182 | Resort Hotel | 709 |
| 8397 | Resort Hotel | 542 |
| 8421 | Resort Hotel | 542 |
| 8422 | Resort Hotel | 542 |
| ... | ... | ... |
| 3603 | Resort Hotel | 0 |
| 3602 | Resort Hotel | 0 |
| 3601 | Resort Hotel | 0 |
| 3600 | Resort Hotel | 0 |
| 20017 | Resort Hotel | 0 |
40060 rows × 2 columns
Q Can you create a data frame that:
- Selects the columns “hotel”, “year”, and “month”
- Sorts by year ascending.
- Masks to only show the month of “August”
Summary of selecting, sorting, and masking.
What did we just do?
We chose a subset of columns that we are interested in
 my_columns = ['hotel','lead_time']
 DF_raw_hotels[my_columns]
Then we decided to sort this data descending
DF_raw_hotels[my_columns].sort_values('lead_time', ascending=False)Then we made a copy of this data to work from and gave it a new name DF_leadtime_sorted
DF_leadtime_sorted = DF_raw_hotels[my_columns].sort_values('lead_time', ascending=False).copy()Finally we decided we only care about resort hotels so we masked out all the other types of hotels
 mask = DF_leadtime_sorted['hotel']== 'Resort Hotel'
 DF_leadtime_sorted[mask]
You can do all of this analysis in one big line:
DF_raw_hotels[['hotel','lead_time']].sort_values('lead_time', ascending=False)[DF_leadtime_sorted['hotel']== 'Resort Hotel']| hotel | lead_time | |
|---|---|---|
| 1 | Resort Hotel | 737 |
| 4182 | Resort Hotel | 709 |
| 8397 | Resort Hotel | 542 |
| 8421 | Resort Hotel | 542 |
| 8422 | Resort Hotel | 542 |
| ... | ... | ... |
| 3603 | Resort Hotel | 0 |
| 3602 | Resort Hotel | 0 |
| 3601 | Resort Hotel | 0 |
| 3600 | Resort Hotel | 0 |
| 20017 | Resort Hotel | 0 |
40060 rows × 2 columns
But I actually think that code is more readable when you break it up a bit and add comments. Here is an example of how I would write my code:
# Here are my parameters: column names and variable info
my_columns = ['hotel','lead_time']
sort_column = 'lead_time'
hotel_type = 'Resort Hotel'

# Sub select my columns and then sort descending
DF_sorted = DF_raw_hotels[my_columns].sort_values(sort_column, ascending=False).copy()
# Do a mask so I am left with only Resort Hotels
mask = DF_leadtime_sorted['hotel']== 'Resort Hotel'
DF_final = DF_sorted[mask].copy()
show(DF_final)| hotel | lead_time | |
|---|---|---|
|
Loading ITables v2.1.4 from the internet...
(need help?) |
Using Logical Operators
Above when we created a boolean mask we check if our data was equal to “Resort Hotel”, this secretly used a logical operator to test equality. We can actually test a lot of things using logical operators:
Basic Operators
| Operator | Definition |
|---|---|
| < | less than |
| > | greater than |
| <= | less than or equal to |
| >= | greater than or equal to |
| == | exactly equal to |
| != | not equal to |
Advanced Operators
| Operator | Definition |
|---|---|
| and | check if two things are both true |
| or | check if one of two things is true |
| in | checks if something is in another thing |
| ! | not checks if something is false |
Extra Advanced Ideas (optional to read)
- In Python there are two operators for and:
- and is a logical and operator, often represented by && in other programming languages
- & is a bitwise and operator, often represented by & in other programming languages
- In Python there are two operators for or:
- or is the logical or operator, often represented by || in other programming languages
- | is the bitwise or operator, often represented by | in other programming languages
Below are some examples. Try to figure out what will be printed before you run the cell!
3<10True10<3False3<10 and 2<10True'cat' == 'cat''CAT'=='cat''CAT'!='cat'2<=22<=2 or 2<1my_numbers = [3,6,18,42]
42 in my_numbersYou probably noticed that when dealing with words (strings) Python is 100% Literal it doesn’t know the difference between upper and lower case.
Q Create 5 more logical operator tests and show the results.
Logical Operators and Data - Example Analysis
Now that we know some logical operators we can create fancier boolean masks and get more interesting subsets of our data. Here is a mini analysis of our data using what we know so far. See if you can figure out what each command is doing. Add your comments explaining the code:
# Add your comments:
DF_raw_hotels['country'].value_counts()
country
PRT 48590
GBR 12129
FRA 10415
ESP 8568
DEU 7287
...
DJI 1
BWA 1
HND 1
VGB 1
NAM 1
Name: count, Length: 177, dtype: int64Wow there is a lot of data for PRT (Portugal)!
# Here I am defining the variables (columns) I care about
my_country = 'PRT'
my_columns = ['hotel',
              'arrival_date_year',
              'is_canceled',
              'arrival_date_month',
              'country']
sort_column = 'arrival_date_year'

# Add your comments:
DF_mini_analysis = DF_raw_hotels[my_columns].sort_values(sort_column).copy()
show(DF_mini_analysis)| hotel | arrival_date_year | is_canceled | arrival_date_month | country | |
|---|---|---|---|---|---|
|
Loading ITables v2.1.4 from the internet...
(need help?) |
# What does this first mask do?
# Your comments:
mask_country = DF_mini_analysis['country']==my_country
DF_mini_analysis_masked = DF_mini_analysis[mask_country]
show(DF_mini_analysis_masked)| hotel | arrival_date_year | is_canceled | arrival_date_month | country | |
|---|---|---|---|---|---|
|
Loading ITables v2.1.4 from the internet...
(need help?) |
# What does this second mask do?
# Your comments:
mask_years = DF_mini_analysis_masked['arrival_date_year']>2015
DF_mini_analysis_masked = DF_mini_analysis_masked[mask_years]
# Notice that I wrote over my data in the command above

show(DF_mini_analysis_masked)| hotel | arrival_date_year | is_canceled | arrival_date_month | country | |
|---|---|---|---|---|---|
|
Loading ITables v2.1.4 from the internet...
(need help?) |
fig = px.histogram(DF_mini_analysis_masked,
                  x='arrival_date_month',
                  color='hotel',
                  facet_col='is_canceled',
                  facet_col_wrap=1)

fig.update_layout(title='Number of Hotels Booked Each Month in Portugal',
                  title_x=0.5,
                  xaxis_title="Month",
                  autosize=False,
                  width=800,
                  height=500)
fig.show()
Q What exactly is this histogram showing and what is excluded based on the analysis we did above? Is there anything interesting about the graph? Any questions raised?
My answer
The graph above shows the number of Hotels book for each month over two years (2016 and 20017). It separates the data by whether the hotels were Resort Hotels or City Hotels. The top graph shows bookings that were canceled and the bottom shows bookings that were not canceled.
From this data I notice a few interesting things. First April, May, and June have the most canceled bookings and it seems like city hotels experience canceled bookings more than resorts. I wonder if the data could tell us more about the type of bookings that tend to be canceled during the Spring/Early summer months. It would also be interesting to compare these results to the results in other countries.
Q Now it’s your turn to do a mini analysis. Please do the following:
- Choose a subset of columns that you are interested in and look just at those column.
- Make at least one mask that will remove some of the data (eg. look only at one categorical value OR one or more numerical values.
- Sort the data using one of the columns.
- Make a histogram or bar graph of your final data set.
- Describe in words what you see in your graph, or if there is anything interesting there.
Excluding variables - removing one column (Extra)
There are a few ways to get rid of columns. The first would be to write down ALL the columns and leave out one. Let’s say we want to leave out information about the “agent” variable.
my_columns = ['hotel', 'is_canceled', 'lead_time', 'arrival_date_year',
              'arrival_date_month', 'arrival_date_week_number',
              'arrival_date_day_of_month', 'stays_in_weekend_nights',
              'stays_in_week_nights', 'adults', 'children', 'babies',
              'meal', 'country', 'market_segment', 'distribution_channel',
              'is_repeated_guest', 'previous_cancellations',
              'previous_bookings_not_canceled', 'reserved_room_type',
              'assigned_room_type', 'booking_changes', 'deposit_type',
              'company', 'days_in_waiting_list', 'customer_type',
              'adr', 'required_car_parking_spaces', 'total_of_special_requests',
              'reservation_status', 'reservation_status_date']

DF_raw_hotels[my_columns]| hotel | is_canceled | lead_time | arrival_date_year | arrival_date_month | arrival_date_week_number | arrival_date_day_of_month | stays_in_weekend_nights | stays_in_week_nights | adults | ... | booking_changes | deposit_type | company | days_in_waiting_list | customer_type | adr | required_car_parking_spaces | total_of_special_requests | reservation_status | reservation_status_date | |
|---|---|---|---|---|---|---|---|---|---|---|---|---|---|---|---|---|---|---|---|---|---|
| 0 | Resort Hotel | 0 | 342 | 2015 | July | 27 | 1 | 0 | 0 | 2 | ... | 3 | No Deposit | NaN | 0 | Transient | 0.00 | 0 | 0 | Check-Out | 2015-07-01 |
| 1 | Resort Hotel | 0 | 737 | 2015 | July | 27 | 1 | 0 | 0 | 2 | ... | 4 | No Deposit | NaN | 0 | Transient | 0.00 | 0 | 0 | Check-Out | 2015-07-01 |
| 2 | Resort Hotel | 0 | 7 | 2015 | July | 27 | 1 | 0 | 1 | 1 | ... | 0 | No Deposit | NaN | 0 | Transient | 75.00 | 0 | 0 | Check-Out | 2015-07-02 |
| 3 | Resort Hotel | 0 | 13 | 2015 | July | 27 | 1 | 0 | 1 | 1 | ... | 0 | No Deposit | NaN | 0 | Transient | 75.00 | 0 | 0 | Check-Out | 2015-07-02 |
| 4 | Resort Hotel | 0 | 14 | 2015 | July | 27 | 1 | 0 | 2 | 2 | ... | 0 | No Deposit | NaN | 0 | Transient | 98.00 | 0 | 1 | Check-Out | 2015-07-03 |
| ... | ... | ... | ... | ... | ... | ... | ... | ... | ... | ... | ... | ... | ... | ... | ... | ... | ... | ... | ... | ... | ... |
| 119385 | City Hotel | 0 | 23 | 2017 | August | 35 | 30 | 2 | 5 | 2 | ... | 0 | No Deposit | NaN | 0 | Transient | 96.14 | 0 | 0 | Check-Out | 2017-09-06 |
| 119386 | City Hotel | 0 | 102 | 2017 | August | 35 | 31 | 2 | 5 | 3 | ... | 0 | No Deposit | NaN | 0 | Transient | 225.43 | 0 | 2 | Check-Out | 2017-09-07 |
| 119387 | City Hotel | 0 | 34 | 2017 | August | 35 | 31 | 2 | 5 | 2 | ... | 0 | No Deposit | NaN | 0 | Transient | 157.71 | 0 | 4 | Check-Out | 2017-09-07 |
| 119388 | City Hotel | 0 | 109 | 2017 | August | 35 | 31 | 2 | 5 | 2 | ... | 0 | No Deposit | NaN | 0 | Transient | 104.40 | 0 | 0 | Check-Out | 2017-09-07 |
| 119389 | City Hotel | 0 | 205 | 2017 | August | 35 | 29 | 2 | 7 | 2 | ... | 0 | No Deposit | NaN | 0 | Transient | 151.20 | 0 | 2 | Check-Out | 2017-09-07 |
119390 rows × 31 columns
TYPING IN ALL THOSE COLUMNS IS A PAIN!!!!!
Luckily Python can help! Here is how we can remove just one thing from a list
# First get all of them
my_columns = list(DF_raw_hotels.keys())
# Then remove the one you don't want
my_columns.remove('agent')
# Then get the new data frame
DF_raw_hotels[my_columns]| hotel | is_canceled | lead_time | arrival_date_year | arrival_date_month | arrival_date_week_number | arrival_date_day_of_month | stays_in_weekend_nights | stays_in_week_nights | adults | ... | booking_changes | deposit_type | company | days_in_waiting_list | customer_type | adr | required_car_parking_spaces | total_of_special_requests | reservation_status | reservation_status_date | |
|---|---|---|---|---|---|---|---|---|---|---|---|---|---|---|---|---|---|---|---|---|---|
| 0 | Resort Hotel | 0 | 342 | 2015 | July | 27 | 1 | 0 | 0 | 2 | ... | 3 | No Deposit | NaN | 0 | Transient | 0.00 | 0 | 0 | Check-Out | 2015-07-01 |
| 1 | Resort Hotel | 0 | 737 | 2015 | July | 27 | 1 | 0 | 0 | 2 | ... | 4 | No Deposit | NaN | 0 | Transient | 0.00 | 0 | 0 | Check-Out | 2015-07-01 |
| 2 | Resort Hotel | 0 | 7 | 2015 | July | 27 | 1 | 0 | 1 | 1 | ... | 0 | No Deposit | NaN | 0 | Transient | 75.00 | 0 | 0 | Check-Out | 2015-07-02 |
| 3 | Resort Hotel | 0 | 13 | 2015 | July | 27 | 1 | 0 | 1 | 1 | ... | 0 | No Deposit | NaN | 0 | Transient | 75.00 | 0 | 0 | Check-Out | 2015-07-02 |
| 4 | Resort Hotel | 0 | 14 | 2015 | July | 27 | 1 | 0 | 2 | 2 | ... | 0 | No Deposit | NaN | 0 | Transient | 98.00 | 0 | 1 | Check-Out | 2015-07-03 |
| ... | ... | ... | ... | ... | ... | ... | ... | ... | ... | ... | ... | ... | ... | ... | ... | ... | ... | ... | ... | ... | ... |
| 119385 | City Hotel | 0 | 23 | 2017 | August | 35 | 30 | 2 | 5 | 2 | ... | 0 | No Deposit | NaN | 0 | Transient | 96.14 | 0 | 0 | Check-Out | 2017-09-06 |
| 119386 | City Hotel | 0 | 102 | 2017 | August | 35 | 31 | 2 | 5 | 3 | ... | 0 | No Deposit | NaN | 0 | Transient | 225.43 | 0 | 2 | Check-Out | 2017-09-07 |
| 119387 | City Hotel | 0 | 34 | 2017 | August | 35 | 31 | 2 | 5 | 2 | ... | 0 | No Deposit | NaN | 0 | Transient | 157.71 | 0 | 4 | Check-Out | 2017-09-07 |
| 119388 | City Hotel | 0 | 109 | 2017 | August | 35 | 31 | 2 | 5 | 2 | ... | 0 | No Deposit | NaN | 0 | Transient | 104.40 | 0 | 0 | Check-Out | 2017-09-07 |
| 119389 | City Hotel | 0 | 205 | 2017 | August | 35 | 29 | 2 | 7 | 2 | ... | 0 | No Deposit | NaN | 0 | Transient | 151.20 | 0 | 2 | Check-Out | 2017-09-07 |
119390 rows × 31 columns
Fancy ways to get columns (EXTRA - ADVANCED)
There are fancy ways to get a list of columns that you might be interested in.
Starts with
You can use the command startswith() to check if a variable starts with a word or part of a word. Here is code to get only columns that start with the word “arrival”:
# Get the list of all the columns
columns_list = list(DF_raw_hotels.keys())
# Get true false values using the startswith() comand
column_mask = [column.startswith('arrival') for column in columns_list]
# Mask the column names to get just the ones you want and make a list
my_columns = list(DF_raw_hotels.keys()[column_mask])
print(my_columns)
['arrival_date_year', 'arrival_date_month', 'arrival_date_week_number', 'arrival_date_day_of_month']Ends with
You can use the command endswith() to check if a variable ends with a word or part of a word. Here is code to get only columns that end with the word “type”:
# Get the list of all the columns
columns_list = list(DF_raw_hotels.keys())
# Get true false values using the startswith() comand
column_mask = [column.endswith('type') for column in columns_list]
# Mask the column names to get just the ones you want and make a list
my_columns = list(DF_raw_hotels.keys()[column_mask])
print(my_columns)
['reserved_room_type', 'assigned_room_type', 'deposit_type', 'customer_type']IN
You can use the Python check is in to check if a variable contains a word or part of a word. Here is code to get only columns that contain the word “date”:
# Get the list of all the columns
columns_list = list(DF_raw_hotels.keys())
# Get true false values using the startswith() comand
column_mask = ["date" in column for column in columns_list]
# Mask the column names to get just the ones you want and make a list
my_columns = list(DF_raw_hotels.keys()[column_mask])
print(my_columns)
['arrival_date_year', 'arrival_date_month', 'arrival_date_week_number', 'arrival_date_day_of_month', 'reservation_status_date']